Wouldn’t it be nice to just sit at your buddy’s house, plug into his network, and see exactly what he’s doing? What if it was as easy as that? What makes packet sniffers like Wireshark such potent tools is that a majority of local area networks (LANs) are based on the shared Ethernet notion.
In a shared Ethernet, you can think of all of the computers in a LAN as being plugged into the same wire, and all of the traffic that travels through it can be captured. Packet sniffers are more formally known as network analyzers and protocol analyzers. But what traffic are we talking about?
Everything. Granted encrypted data will be unreadable to you, you can still see it, and anything that is sent plain text (not encrypted) can be grabbed very easily. This includes passwords, logins, instant messaging conversations, emails, etc. Everything.
For example, assume that your network card picks up a packet fromsomeone else’s network. Normally, once the packet is handed off, the operating system must determine exactly what type of packet it is. To do so, it strips off the Ethernet header of the packet and looks at the next layer. Perhaps it’s an IP packet.. Well, the OS must now strip of the IP header and determine which type of IP packet it is. Finally, let’s say it’s determined that the packet is a UDP packet. The UDP header is stripped off and the packet payload (the data) is handed over to the application that the packet was sent to.
Now, this is an oversimplified version of what really goes on, but I’m trying to illustrate a point. Packet capture allows us to intercept any packet that is seen by the network device, and grab it in its entirety, headers and all. Regardless of which port is being sent to, or even which host, for that matter.
Let’s Steal Some Data!
If you’re running BackTrack, you already have this set up in your /pentest directory. Otherwise, let’s go ahead and grab the packages. If you want the latest version of 1.6.5, you must download and compile the source code. If you don’t mind the older 1.6.2 version, you can use the repositories. In this case, I recommend the repos if you feel shy about compiling from source and handling dependencies. If you want the bleeding edge, grab the source. As of this writing, it’s a small difference.
Free BSD users can type:
$ sudo pkg_add -r wireshark
Debian-based systems can type:
$ sudo apt-get install wireshark
Arch users can type:
$ sudo pacman -S wireshark-gtk
If you do wish to compile from source, follow along below:
Step 1 Get All The Required Packages
Make a new temporary directory, because we’re going to download some files. Wireshark also requires libpcap, glib, and GTK+ as dependencies. Backtrack users should again be good to go, but others might need to get these packages first.
Download the source code with Wget and compile it up.
$ wget http://www.tcpdump.org/release/libpcap-1.2.1.tar.gz
$ wget http://ftp.gnome.org/pub/gnome/sources/glib/2.30/glib-2.30.2.tar.bz2
$ wget http://ftp.gnome.org/pub/gnome/sources/gtk+/3.2/gtk+-3.2.2.tar.bz2
Windows users can grab the 32-bit and 64-bit versions of Wireshark. Linux users can simply retrieve the source code by typing:
$ wget http://wiresharkdownloads.riverbed.com/wireshark/src/wireshark-1.6.5.tar.bz2
Step 2 Build and Install the Dependencies
Untar each package you downloaded, then move into the new expanded directory and type the following for each:
$ ./configure
$ sudo make
$ sudo make install
Step 3 Build and Install Wireshark
Now we can get to installing our network protocol analyzer, Wireshark. If you have any issues or problems at this stage with dependencies, check out this helpful link.
To get started, let’s type:
$ tar xvjf wireshark-1.6.5.tar.bz2 && cd wireshark-1.6.5
$ ./configure
$ sudo make
$ sudo make install
Step 4 Configure, Capture and Conquer
Now that we have everything up and running, let’s go ahead and fire up Wireshark. We should be greeted with the following screen:
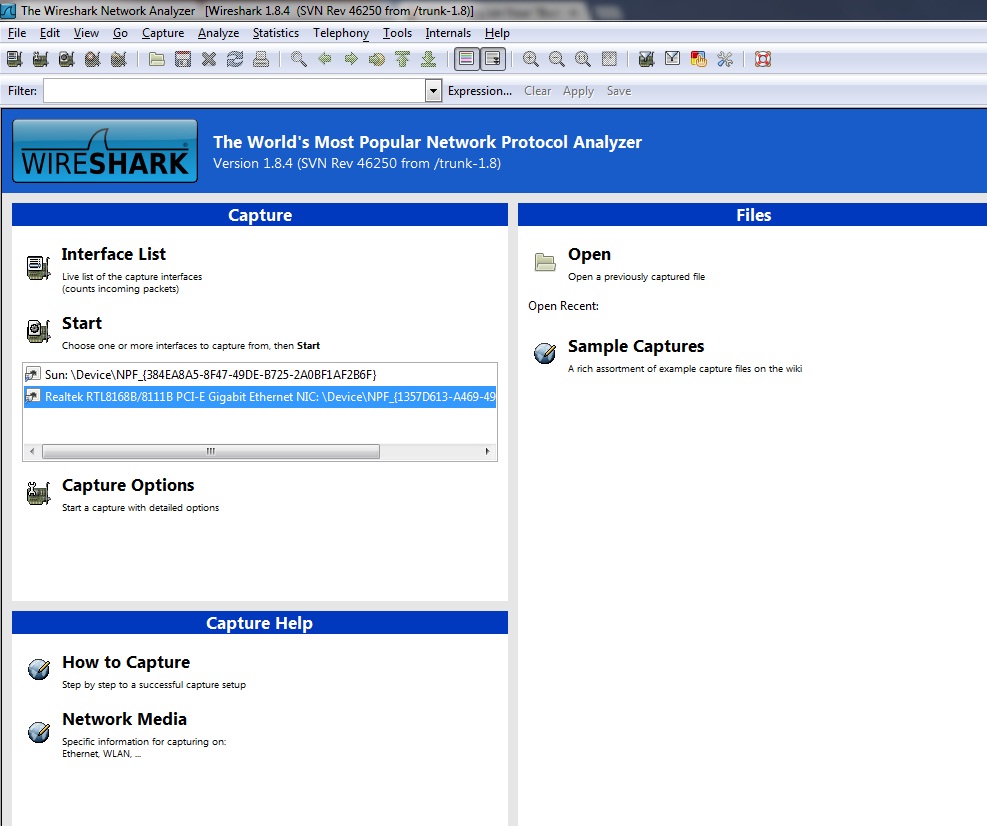
You’ll see a section titled Capture Help—I highly encourage first time users to give it a whirl. Also notice that if you had captured packets on another computer, you could import that file into Wireshark for analysis, as well.
Under Capture, it lists all the interfaces on your system Wireshark can use to listen in on. /dev/eth1 is my wireless interface, so let’s click on that.
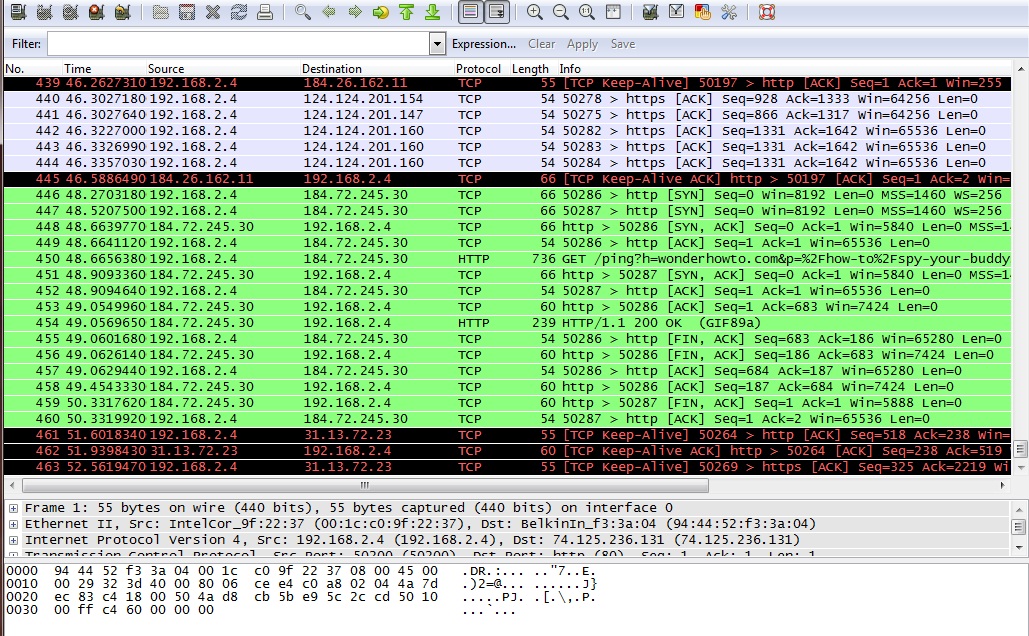
Here, we listened in on the interface only for a few seconds and picked up 24 packets. The first column lists the packet number, ordered in how they were received. The next column lists the time in seconds, which began when Wireshark started that session.
Source and Destination
The Source and Destination columns list the addresses contained in the header. You will notice packets that are addressed for you will show your internal IP address. This is because right now we are listening to the wireless traffic inside a network and as such, are behind the router. Packets coming to the receiving computer have already been stripped of the network IP address by the router. Remember how each layer of the OSI model can only talk to the layers above and below? That’s because as the data travels up and down the layers, the control info is added to it, and stripped off as it passes.
Next to that lists the Protocol of the packets received. Notice in the image where it says TLSv1 and Encrypted Alert in the info status? TLS stands for Transport Layer Security and if you remember from above, it runs on the transport layer.
Packet Overview
Under that lies an overview of the packet, giving you details such as size and what ports it was addressed to.
Click on one of the entries and move your keyboard arrows up and down. See how the highlighted block of jumbled letters and numbers moves along with it? All those jumbled letters and numbers are actually hexadecimal code, and next to it is a quick decoded overview of the data. If items are being transmitted encrypted, then this won’t be enough yet, but anything sent plain text will show up here.
In Action
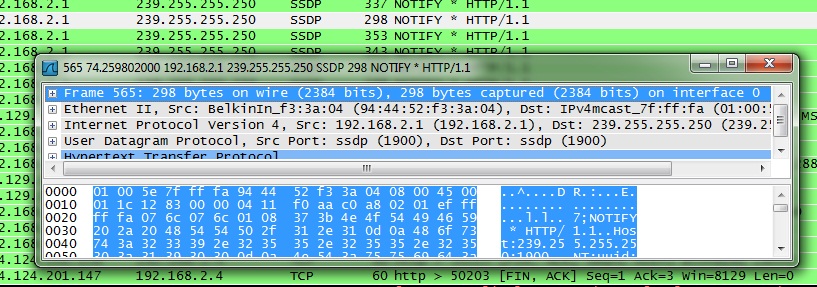
Here, I opened my browser and typed www.google.com into the bar. Your computer sends a request to a DNS server to find out the IP associated with google.com. The server then returns the address back to you and your browser connects to it. We can see this in action by sniffing the traffic as it happens.
![]()
Here you can see the protocol is DNS. The first packet is querying the server and the second packet is responding.
In Closing
Whew, that was a long read, but hopefully it was full of good knowledge. Sniffing traffic is useful for a multitude of reasons, from protecting your network from leaks by testing it out, to peeking at data that was not meant for your eyes. Next week, we’ll get into advanced capturing of wireless packets, and dig into Wireshark a little more deeper.
This is very misleading. The only time that this will work (in terms of seeing your “buddy’s” traffic is if their connections are over a hub. Most of the time, it’s switched ethernet (over a switch), and this is only made possible by ARP spoofing…